Marketing digital
France
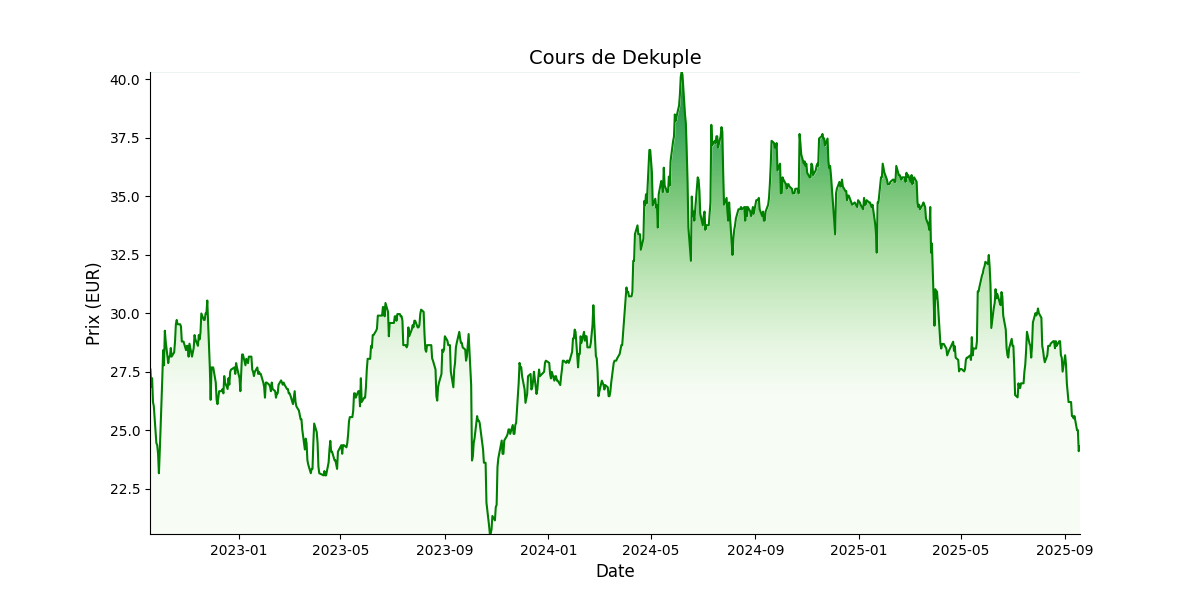
 Target Price: EUR 38,5Current Price: EUR 28,2
Shareholding:
Flottant: 20.6%
Famille Vigneron: 75.1%
Auto-détention: 4.3%
Apercu
Acteur majeur du marketing digital en France, Dékuple (ex ADLPartner) est un groupe familial à suivre de près. Fin 2020, la société a entamé son plan stratégique quinquennal «Ambition 2025» avec pour objectif de devenir un leader européen du marketing de données. Le groupe bâtit ainsi son projet autour de la croissance organique de ses activités ainsi que d’acquisitions stratégiques comme Converteo, Reech, Brainsonic ou encore GUD.berlin. Fort de son positionnement unique sur le marché en plein essor de l’exploitation des données marketing et doté d’une expertise technologique différenciante, Dékuple a depuis lors
considérablement amélioré ses fondamentaux et enregistré une croissance soutenue de son chiffre d’affaires (TCAM 2020-2023: +12,7%).
Management de
Dekuple
- Bertrand Laurioz (Président-Directeur général)
- Emmanuel Gougeon (Directeur Général Adjoint, Finances)
| Données financières (M€) | 2022 | 2023 | 2024 | 2025e | 2026e | 2027e |
|---|---|---|---|---|---|---|
| Chiffre d'affaires | 181,3 | 199,7 | 217,8 | 240,0 | 264,2 | 284,5 |
| Croissance (%) | 10,3% | 10,2% | 9,1% | 10,2% | 10,1% | 7,7% |
| EBE | 22,1 | 24,6 | 23,9 | 28,0 | 31,6 | 34,4 |
| Marge EBE (%) | 12,2% | 12,3% | 11,0% | 11,7% | 11,9% | 12,1% |
| ROC | 17,0 | 17,5 | 16,4 | 20,1 | 22,1 | 24,1 |
| Marge opérationnelle courante (%) | 9,4% | 8,8% | 7,5% | 8,4% | 8,3% | 8,5% |
| Résultat net part du groupe | 10,9 | 12,4 | 10,1 | 13,6 | 14,9 | 16,4 |
| Marge nette (%) | 6,0% | 6,2% | 4,6% | 5,7% | 5,7% | 5,7% |
| BPA - publié et non dilué | 2,7 | 3,1 | 2,5 | 3,3 | 3,6 | 3,9 |
| Dividende/action | 0,9 | 1,0 | 0,8 | 1,0 | 1,1 | 1,2 |
| Croissance (%) | 0,0% | 18,2% | -26,9% | 28,6% | 10,1% | 9,4% |
| Dette nette/(trésorerie nette) | 6,0 | -2,0 | 21,8 | 2,8 | -16,7 | -36,8 |
| Gearing (%) | 16,1% | -3,9% | 39,7% | 4,4% | -22,4% | -42,7% |
| Dette nette/EBE (x) | 0,3 | -0,1 | 0,9 | 0,1 | -0,5 | -1,1 |
| FCF | 15,8 | 24,3 | 19,7 | 22,0 | 23,5 | 24,6 |
| ROCE (%) | 27,9% | 24,7% | 15,3% | 21,0% | 26,1% | 32,9% |
| VE/CA (x) | 0,8 | 0,7 | 0,8 | 0,7 | 0,5 | 0,4 |
| VE/EBE (x) | 6,2 | 5,3 | 7,7 | 5,7 | 4,4 | 3,5 |
| VE/ROC (x) | 8,0 | 7,5 | 11,2 | 7,9 | 6,3 | 5,0 |
| P/E (x) | 11,0 | 9,4 | 13,7 | 9,7 | 8,8 | 8,1 |
| FCF yield (%) | 11,5% | 18,6% | 10,8% | 13,9% | 16,8% | 20,5% |
| Dividend yield (%) | 2,9% | 3,5% | 2,2% | 3,1% | 3,4% | 3,7% |