Energie
France
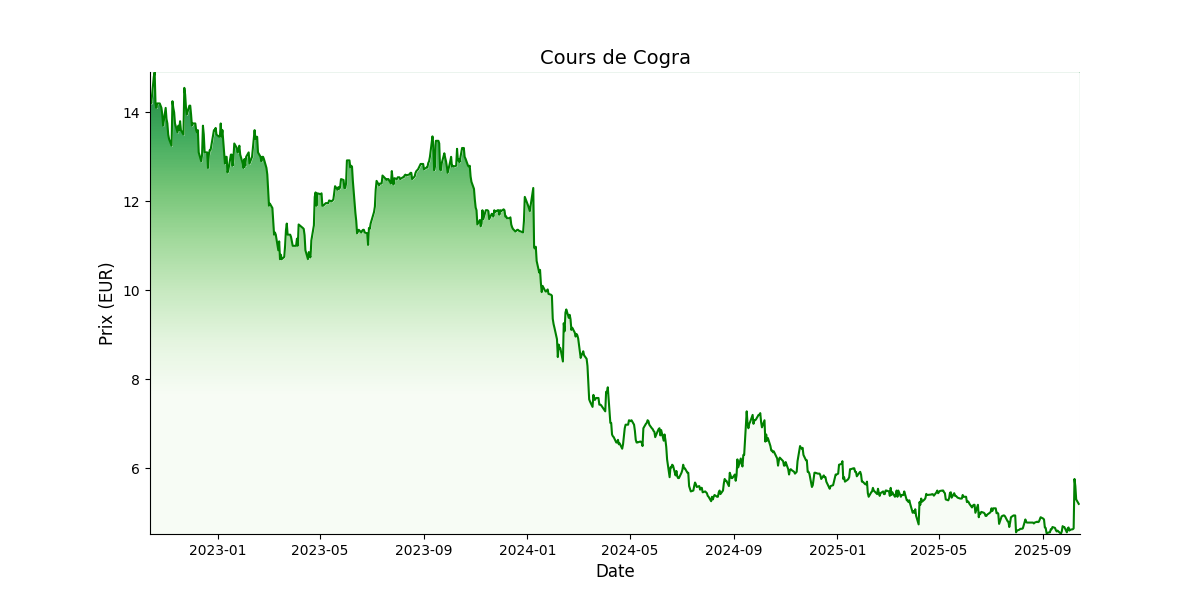
 Target Price: EUR 6,5Current Price: EUR 7,4
Shareholding:
Flottant: 26%
Nextstage: 30.6%
Historiques: 25%
Eximium: 10.6%
Apercu
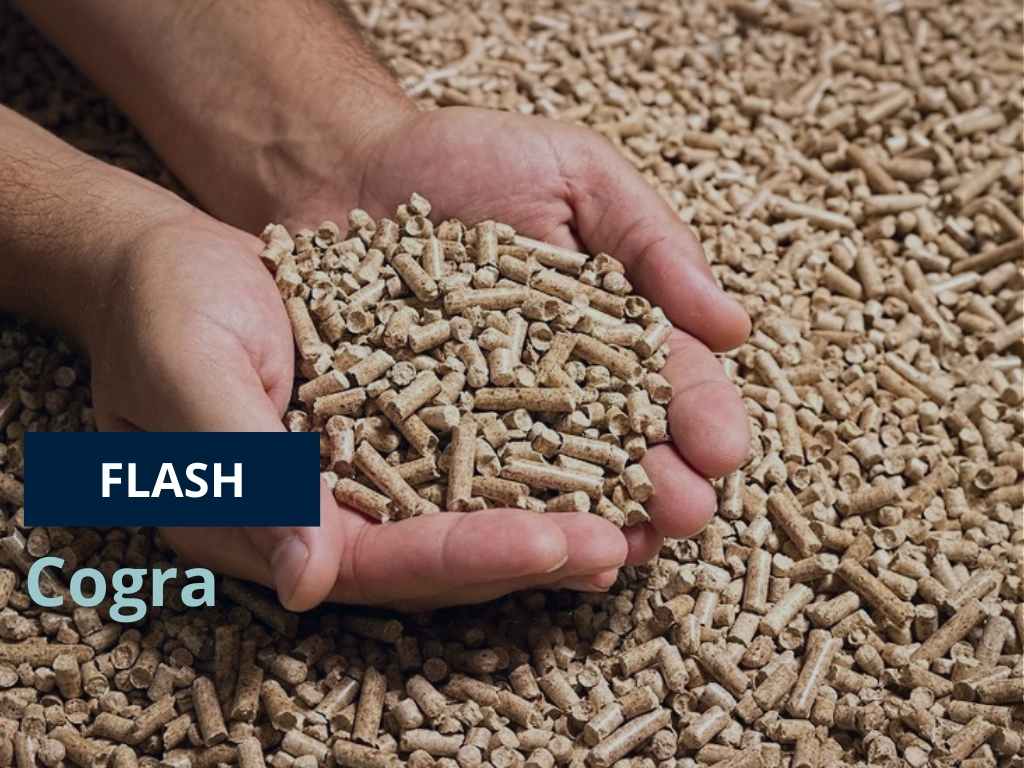
Créé en 1982, Cogra est un producteur de granulés de bois, certifiés DIN+. Issus des connexes de la première transformation du bois, les granulés, une fois brûlés, produisent de la chaleur ou de l’énergie. Cogra ne détient aucune forêt, mais trois sites de production: un à Séverac (12) et deux à Craponne-sur-Arzon (43). Ils totalisent une capacité de production de près de 200 000 tonnes par an. Le groupe est par ailleurs revendeur de chaudières Froling et importateur de poêles Harman. Cogra est une société mature et par conséquent rentable, forte de liens historiques avec les forestiers locaux et de coûts d’exploitation maitrisés. Le groupe doit maintenant continuer à capitaliser sur la place essentielle qu’il occupe dans la transition énergétique
Management de
Cogra
- François Chapon (PDG)
| Données financières (M€) | 22/23 | 23/24 | 24/25 | 25/26e | 26/27e | 27/28e |
|---|---|---|---|---|---|---|
| Chiffre d'affaires | 51,2 | 39,0 | 34,3 | 38,8 | 43,3 | 47,4 |
| Croissance (%) | -23,8% | -12,2% | 13,1% | 11,8% | 9,5% | |
| EBE | 8,5 | 4,1 | -1,5 | 3,2 | 3,8 | 4,3 |
| Marge EBE (%) | 16,5% | 10,6% | -4,5% | 8,2% | 8,7% | 9,1% |
| ROC | 5,5 | 0,9 | -4,8 | 0,7 | 1,0 | 1,2 |
| Marge opérationnelle courante (%) | 10,8% | 2,4% | -14,0% | 1,7% | 2,2% | 2,6% |
| Résultat net part du groupe | 4,1 | 0,6 | -4,7 | 0,4 | 0,6 | 0,8 |
| Marge nette (%) | 8,0% | 1,6% | -13,7% | 1,0% | 1,5% | 1,8% |
| BPA - publié et non dilué | 1,2 | 0,2 | -1,4 | 0,1 | 0,2 | 0,2 |
| Dividende/action | 0,0 | 0,0 | 0,0 | 0,0 | 0,0 | 0,0 |
| Croissance (%) | ||||||
| Dette nette/(trésorerie nette) | 3,9 | 8,9 | 2,9 | 1,5 | 0,4 | -1,2 |
| Gearing (%) | 15,2% | 34,2% | 13,8% | 6,7% | 1,6% | -5,4% |
| Dette nette/EBE (x) | 0,5 | 2,2 | -1,9 | 0,5 | 0,1 | -0,3 |
| FCF | 1,8 | -5,0 | 5,4 | 1,5 | 1,1 | 1,6 |
| ROCE (%) | 14,2% | 2,0% | -14,9% | 2,1% | 3,2% | 4,3% |
| VE/CA (x) | 0,9 | 1,1 | 0,6 | 0,5 | 0,4 | 0,4 |
| VE/EBE (x) | 5,6 | 10,5 | 6,4 | 5,1 | 4,1 | |
| VE/ROC (x) | 8,5 | 45,6 | 31,0 | 19,7 | 14,1 | |
| P/E (x) | 10,7 | 55,8 | 50,6 | 30,0 | 22,7 | |
| FCF yield (%) | 3,8% | -11,5% | 28,4% | 7,3% | 5,7% | 9,1% |
| Dividend yield (%) | 0,0% | 0,0% | 0,0% | 0,0% | 0,0% | 0,0% |