Cleantech
France
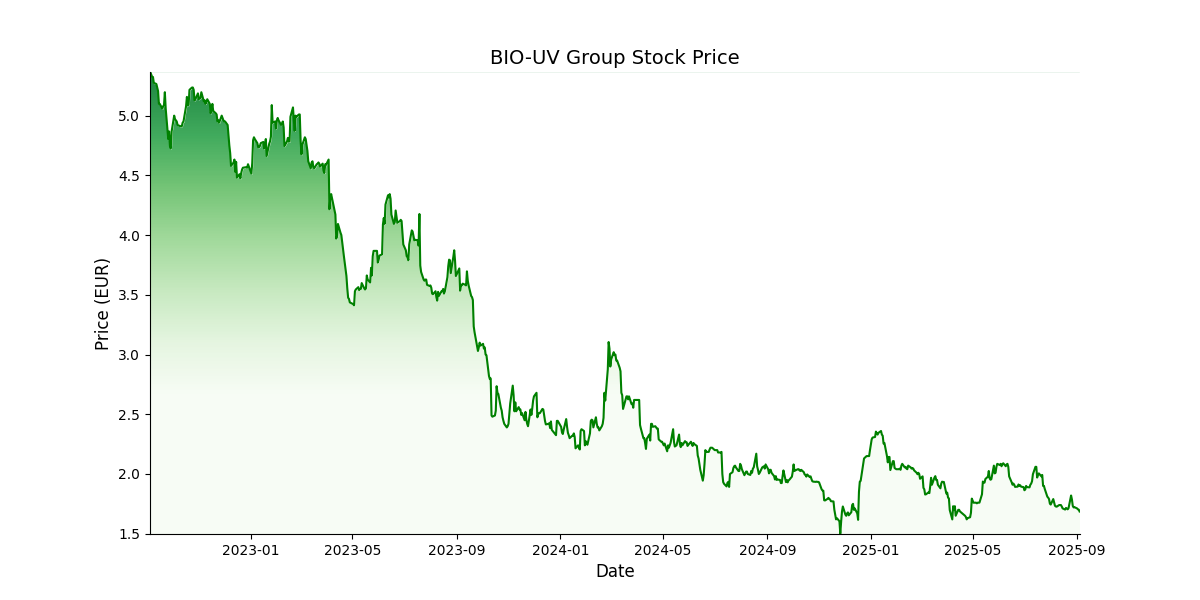
 Prix cible: EUR 3,0Prix actuel: EUR 1,3
Actionnariat:
Flottant: 96.1%
Managers : 1.5%
Autocontrôle: 2.4%
Apercu
Depuis sa création en 2000, Bio-UV Group conçoit, fabrique et commercialise des systèmes de désinfection et de traitement de l’eau sans chimie à travers le monde. La société est positionnée sur deux segments principaux: les eaux récréatives (municipales, piscines) et industrielles, cœur de métier historique du groupe, ainsi que le marché des eaux de ballast, depuis 2011. Bio-UV dispose d’une gamme reconnue (et certifiée) de produits maritimes et terrestres (ultraviolet, ozone, AOP, électrolyse de sel), qui a su s’étoffer avec le temps à travers une politique active de croissance externe. La récente acquisition de Corelec en novembre 2021 (électrolyse de sel) devrait notamment permettre au groupe de rentrer dans une nouvelle dimension.
Management de
BIO-UV Group
- Sébastien MARIN-LAFLECHE (DAF)
- Laurent-Emmanuel Migeon (PDG)
A la rencontre du dirigeant
| Données financières (M€) | 2022 | 2023 | 2024 | 2025e | 2026e | 2027e |
|---|---|---|---|---|---|---|
| Chiffre d'affaires | 51,3 | 43,1 | 39,6 | 39,6 | 41,8 | 44,0 |
| Croissance (%) | 53,3% | -15,9% | -8,2% | 0,2% | 5,4% | 5,2% |
| EBE | 7,1 | 5,5 | 5,3 | 4,8 | 5,2 | 5,8 |
| Marge EBE (%) | 13,8% | 12,8% | 13,5% | 12,1% | 12,6% | 13,1% |
| ROC | 4,1 | 2,3 | 2,1 | 1,8 | 2,5 | 3,6 |
| Marge opérationnelle courante (%) | 8,1% | 5,3% | 5,4% | 4,6% | 6,1% | 8,1% |
| Résultat net part du groupe | 2,4 | 0,1 | 0,0 | 0,7 | 1,3 | 2,1 |
| Marge nette (%) | 4,7% | 0,3% | 0,1% | 1,9% | 3,0% | 4,7% |
| BPA - publié et non dilué | 0,2 | 0,0 | 0,0 | 0,1 | 0,1 | 0,1 |
| Dividende/action | 0,1 | 0,0 | 0,0 | 0,0 | 0,0 | 0,0 |
| Croissance (%) | 20,0% | |||||
| Dette nette/(trésorerie nette) | 25,4 | 22,0 | 17,5 | 7,5 | 4,8 | 2,9 |
| Gearing (%) | 78,6% | 68,2% | 53,4% | 18,4% | 11,3% | 6,5% |
| Dette nette/EBE (x) | 3,6 | 4,0 | 3,3 | 1,6 | 0,9 | 0,5 |
| FCF | 0,6 | 4,3 | 5,0 | 2,4 | 2,7 | 1,9 |
| ROCE (%) | 5,2% | 3,0% | 3,0% | 2,7% | 3,8% | 5,3% |
| VE/CA (x) | 1,9 | 1,8 | 1,2 | 0,9 | 0,8 | 0,7 |
| VE/EBE (x) | 13,4 | 13,7 | 9,1 | 7,5 | 6,3 | 5,4 |
| VE/ROC (x) | 23,0 | 32,9 | 22,7 | 19,6 | 13,2 | 8,8 |
| P/E (x) | 28,6 | 37,8 | 22,3 | 13,8 | ||
| FCF yield (%) | 0,8% | 7,1% | 12,7% | 8,8% | 10,9% | 8,3% |
| Dividend yield (%) | 1,2% | 0,0% | 0,0% | 0,0% | 0,0% | 0,0% |