Industriel
France
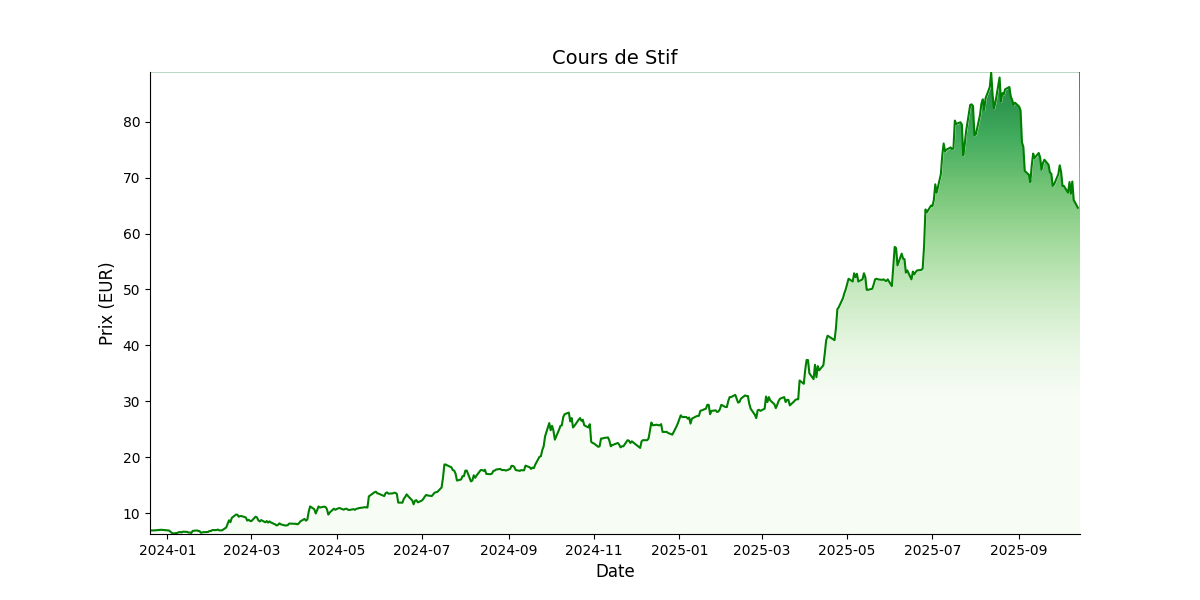
 Prix cible: EUR 95,2Prix actuel: EUR 51,5
Actionnariat:
JB PARTICIPATIONS: 52.3%
Flottant: 31.3%
Manuel Burgos: 10.7%
Valérie Burgos: 5.7%
Françoise Burgos: 0%
Apercu
Fondé en 1984, le Groupe STIF est un acteur industriel français spécialisé dans la conception, la fabrication et la commercialisation de matériels innovants pour des marchés de niche. Historiquement centré sur les équipements de manutention pour produits en vrac, le Groupe s’est diversifié ces dix dernières années dans la protection contre les explosions de poussières industrielles et des systèmes de stockage d’énergie par batterie (BESS). Avec près de 350 collaborateurs, 5 usines dans le monde et des produits reconnus à l’international, STIF ambitionne de devenir un acteur majeur de la sécurité industrielle et énergétique en Europe et à l’international.
Management de
Stif
- José Burgos (DG)
- Christophe Canal (DAF)
| Données financières (M€) | 2022 | 2023 | 2024 | 2025e | 2026e | 2027e |
|---|---|---|---|---|---|---|
| Chiffre d'affaires | 31,2 | 35,5 | 61,2 | 90,5 | 119,2 | 134,4 |
| Croissance (%) | 13,8% | 72,7% | 47,8% | 31,8% | 12,7% | |
| EBE | 3,5 | 4,7 | 15,7 | 22,5 | 27,2 | 30,1 |
| Marge EBE (%) | 11,2% | 13,3% | 25,7% | 24,9% | 22,8% | 22,4% |
| ROC | 2,6 | 3,2 | 13,2 | 19,1 | 22,8 | 25,2 |
| Marge opérationnelle courante (%) | 8,2% | 8,9% | 21,6% | 21,1% | 19,1% | 18,7% |
| Résultat net part du groupe | 1,7 | 2,0 | 9,7 | 13,2 | 16,0 | 17,9 |
| Marge nette (%) | 5,5% | 5,6% | 15,8% | 14,6% | 13,5% | 13,3% |
| BPA - publié et non dilué | 0,3 | 0,4 | 1,9 | 2,6 | 3,1 | 3,5 |
| Dividende/action | 0,0 | 0,2 | 0,6 | 0,6 | 0,6 | 0,4 |
| Croissance (%) | 210,5% | 8,9% | -2,7% | -33,1% | ||
| Dette nette/(trésorerie nette) | 4,2 | -2,1 | -5,7 | 13,0 | 3,4 | -11,8 |
| Gearing (%) | 70,2% | -9,3% | -22,4% | 39,6% | 8,1% | -18,1% |
| Dette nette/EBE (x) | 1,1 | -0,3 | -0,3 | 0,6 | 0,1 | -0,4 |
| FCF | -0,6 | -1,0 | 8,5 | -0,6 | 13,1 | 18,6 |
| ROCE (%) | 17,8% | 16,2% | 51,4% | 29,3% | 32,6% | 35,9% |
| VE/CA (x) | 1,6 | 1,0 | 2,4 | 3,2 | 2,4 | 2,0 |
| VE/EBE (x) | 14,5 | 7,7 | 9,5 | 13,1 | 10,5 | 9,0 |
| VE/ROC (x) | 19,8 | 11,5 | 11,3 | 15,4 | 12,5 | 10,8 |
| P/E (x) | 26,1 | 18,1 | 15,8 | 21,1 | 17,3 | 15,5 |
| FCF yield (%) | -1,1% | -2,6% | 5,7% | -0,2% | 4,6% | 6,9% |
| Dividend yield (%) | 0,0% | 2,7% | 2,0% | 1,2% | 1,2% | 0,8% |