Medtech
France
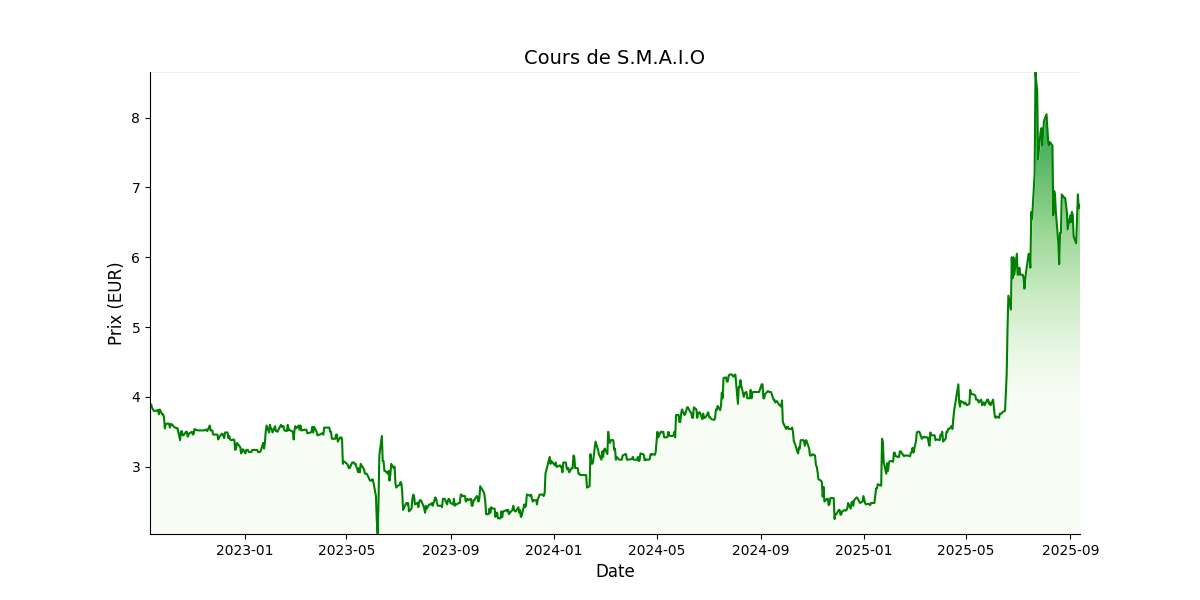
 Prix cible: EUR 8,2Prix actuel: EUR 8,0
Actionnariat:
Sylorus Scientific: 45.2%
JC Roussouly: 14.7%
NuVasive: 13.2%
Nextstage: 11.4%
Eiffel: 8.4%
Apercu
Fondé en 2009 SMAIO (Software, Machines and Adaptative Implants in Orthopaedics), acteur français de l’orthopédie, se positionne sur les segments à forte valeur ajoutée des dispositifs médicaux dédiés à la chirurgie rachidienne complexe impliquant la nécessité de restaurer l’équilibre de la colonne vertébrale.
Management de
S.M.A.I.O
- Philippe Roussouly (CEO)
- Renaut Fritsch (CFO)
A la rencontre du dirigeant
| Données financières (M€) | 2022 | 2023 | 2024 | 2025 | 2026 | 2027e |
|---|---|---|---|---|---|---|
| Chiffre d'affaires | 2,3 | 5,4 | 5,5 | 9,2 | 12,2 | 15,3 |
| Croissance (%) | 8,1% | 133,8% | 2,1% | 67,4% | 32,5% | 25,6% |
| EBE | -2,7 | 0,1 | -1,8 | -1,0 | 0,2 | 1,1 |
| Marge EBE (%) | -116,5% | 2,7% | -31,8% | -10,4% | 1,9% | 7,2% |
| ROC | -4,1 | -1,1 | -3,2 | -2,3 | -1,6 | -1,2 |
| Marge opérationnelle courante (%) | -179,6% | -20,0% | -57,9% | -25,4% | -13,1% | -7,8% |
| Résultat net part du groupe | 2,6 | -0,4 | -2,3 | -2,0 | -1,0 | -0,4 |
| Marge nette (%) | 114,2% | -8,3% | -42,7% | -21,9% | -8,3% | -2,3% |
| BPA - publié et non dilué | 0,5 | -0,1 | -0,5 | -0,4 | -0,1 | -0,1 |
| Dividende/action | 0,0 | 0,0 | 0,0 | 0,0 | 0,0 | 0,0 |
| Croissance (%) | ||||||
| Dette nette/(trésorerie nette) | -2,9 | -3,9 | -0,9 | -0,4 | -2,8 | -2,7 |
| Gearing (%) | -30,3% | -41,7% | -13,4% | -7,1% | -33,0% | -32,3% |
| Dette nette/EBE (x) | 1,1 | -26,6 | 0,5 | 0,5 | -12,1 | -2,4 |
| FCF | 2,5 | -1,2 | -2,9 | -1,9 | -1,0 | -0,2 |
| ROCE (%) | -45,6% | -14,4% | -39,2% | -29,4% | -20,0% | -15,5% |
| VE/CA (x) | 7,6 | 2,1 | 3,0 | 2,9 | 3,2 | 2,6 |
| VE/EBE (x) | 76,8 | |||||
| VE/ROC (x) | ||||||
| P/E (x) | 8,0 | |||||
| FCF yield (%) | 13,2% | -10,6% | -17,4% | -7,0% | -2,8% | -0,4% |
| Dividend yield (%) | 0,0% | 0,0% | 0,0% | 0,0% | 0,0% | 0,0% |