Energie
France
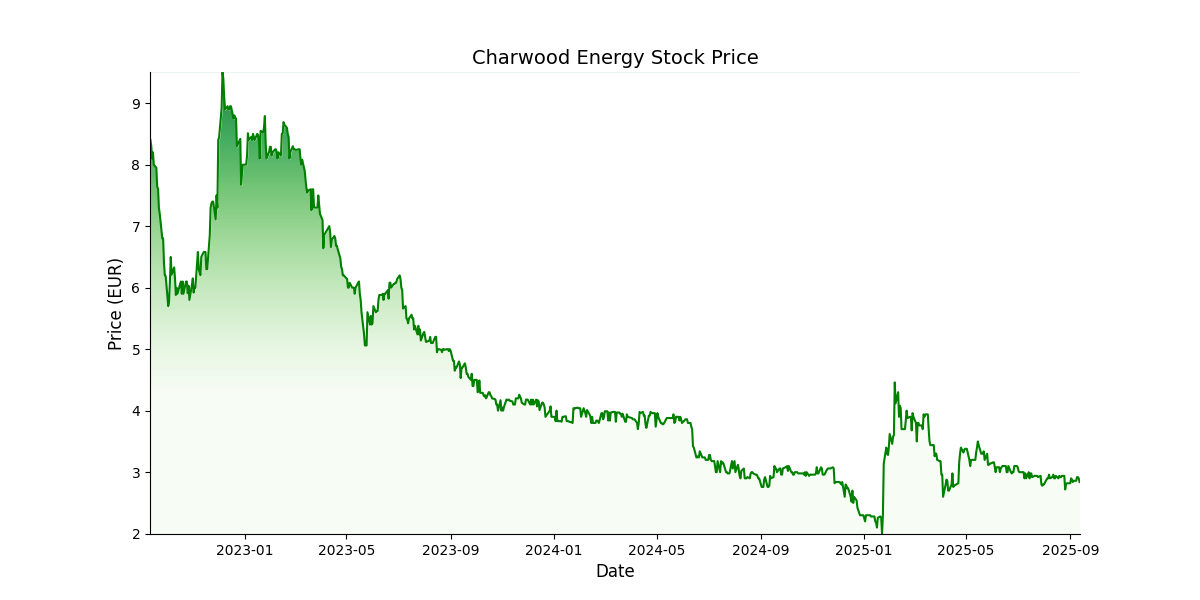
 Prix cible: EUR 5,5Prix actuel: EUR 3,4
Actionnariat:
A.Haller et J.Bouvier: 57.7%
Johes SAS: 16.4%
Eiffel Gaz Vert: 14.3%
Autres: 7%
Flottant: 5%
Apercu
Société créée en 2006 par son actuel PDG et actionnaire majoritaire, Charwood Energy est une PME bretonne spécialisée dans la valorisation énergétique de la biomasse sous toutes ses formes. Le groupe offre des solutions sur-mesure à ses clients (collectivités, industriels, exploitants agricoles), désireux de réduire une partie de leur empreinte carbone, et exploite un double modèle d’EPC (pour compte de tiers) et d’IPP (pour compte propre) Avec plus de 100 projets réalisés pour compte de tiers depuis sa création, soit une puissance cumulée de 54 MW produisant environ 250 GWh/an, la société dispose d’un track record de 15 ans, aussi solide que diversifié.
Management de
Charwood Energy
- Adrien Haller (PDG)
- Pierre-Yves Lefebvre (DAF)
A la rencontre du dirigeant
| Données financières (M€) | 2021 | 2022 | 2023 | 2024 | 2025 | 2026 |
|---|---|---|---|---|---|---|
| Chiffre d'affaires | 4,6 | 4,9 | 4,1 | 5,1 | 9,3 | 11,1 |
| Croissance (%) | 112,8% | 6,6% | -15,8% | 23,6% | 83,0% | 19,5% |
| EBE | 1,0 | -0,3 | -1,5 | -2,7 | -0,7 | 0,6 |
| Marge EBE (%) | 22,8% | -6,5% | -37,7% | -53,0% | -7,8% | 5,3% |
| ROC | 0,9 | -0,5 | -2,0 | -3,2 | -1,2 | -0,1 |
| Marge opérationnelle courante (%) | 19,3% | -11,1% | -48,3% | -64,2% | -13,3% | -0,7% |
| Résultat net part du groupe | 0,6 | -0,5 | -1,6 | -3,5 | -1,0 | -0,2 |
| Marge nette (%) | 12,3% | -11,1% | -38,2% | -69,3% | -11,1% | -2,1% |
| BPA - publié et non dilué | -0,1 | -0,3 | -0,7 | -0,2 | 0,0 | |
| Dividende/action | 0,0 | 0,0 | 0,0 | 0,0 | 0,0 | 0,0 |
| Croissance (%) | ||||||
| Dette nette/(trésorerie nette) | -4,8 | -0,3 | 1,7 | 2,1 | 2,7 | |
| Gearing (%) | 65,6% | -47,7% | -3,9% | 34,4% | 55,9% | 77,1% |
| Dette nette/EBE (x) | 0,5 | 15,2 | 0,2 | -0,6 | -2,9 | 4,7 |
| FCF | 0,7 | -4,0 | -4,2 | -1,8 | -0,5 | -0,6 |
| ROCE (%) | 47,3% | -7,6% | -18,1% | -37,1% | -15,5% | -0,9% |
| VE/CA (x) | 7,4 | 5,6 | 3,7 | 2,0 | 1,8 | |
| VE/EBE (x) | 33,2 | |||||
| VE/ROC (x) | ||||||
| P/E (x) | ||||||
| FCF yield (%) | -3,2% | |||||
| Dividend yield (%) | 0,0% | 0,0% | 0,0% | 0,0% | 0,0% | 0,0% |