Distribution
France
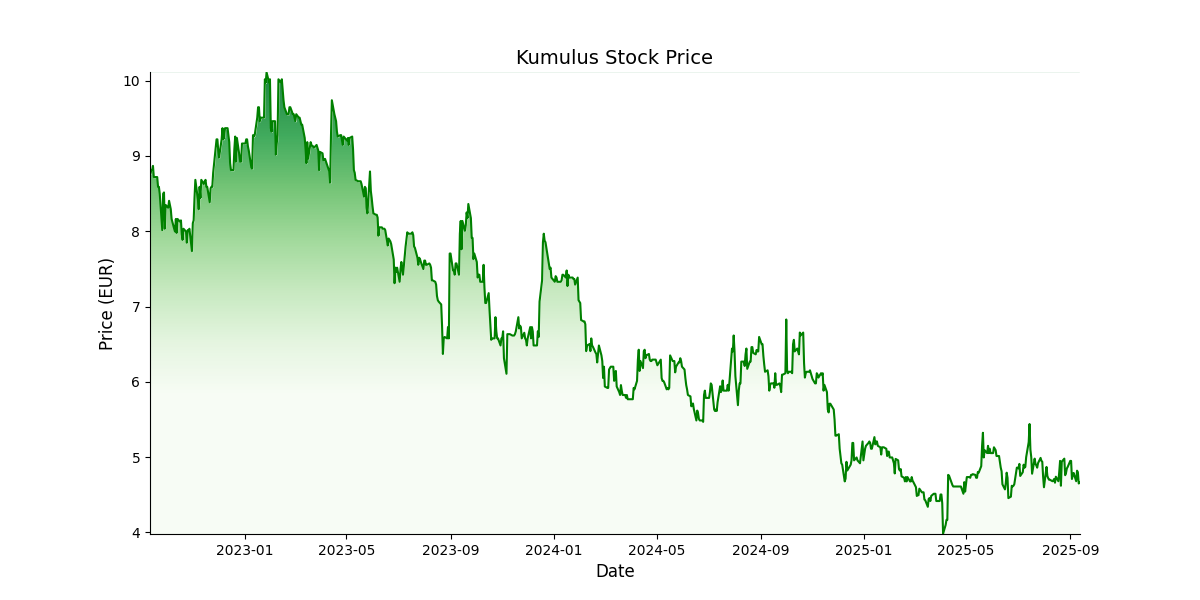
 Prix cible: EUR 6,9Prix actuel: EUR 3,1
Actionnariat:
Flottant: 53%
Fondateurs & management: 37%
Partenaires: 9.5%
Salariés: 0.5%
Apercu
Fondée en 2012 par Rémi Baert, Kumulus Vape est une société de croissance spécialisée dans la vente de produits de vapotage. La société distribue et commercialise des cigarettes électroniques et des produits associés (matériel, e-liquides et accessoires) via ses deux plateformes de vente en ligne. Initialement orientée vers la vente aux particuliers (BtoC), Kumulus Vape a rapidement investi le marché des professionnels (BtoB) avec la création en 2017 de son site www.kmls.fr. Dans un marché atomisé, Kumulus Vape se distingue en proposant l’une des offres les plus riches du marché (7 000 références et 300 marques)
Management de
Kumulus
- Rémi Baert (PDG)
- Laetitia Touchet (DAF)
A la rencontre du dirigeant
| Données financières (M€) | 2022 | 2023 | 2024 | 2025 | 2026 | 2027 |
|---|---|---|---|---|---|---|
| Chiffre d'affaires | 55,7 | 62,6 | 60,7 | 57,0 | 59,6 | 60,6 |
| Croissance (%) | 61,5% | 12,4% | -3,0% | -6,1% | 4,5% | 1,7% |
| EBE | 3,3 | 3,6 | 4,1 | 2,8 | 3,2 | 3,4 |
| Marge EBE (%) | 5,9% | 5,7% | 6,8% | 5,0% | 5,4% | 5,6% |
| ROC | 3,1 | 3,1 | 3,9 | 2,3 | 2,7 | 2,9 |
| Marge opérationnelle courante (%) | 5,5% | 4,9% | 6,5% | 4,1% | 4,6% | 4,8% |
| Résultat net part du groupe | 2,3 | 1,9 | 2,6 | 1,3 | 2,1 | 2,2 |
| Marge nette (%) | 4,1% | 3,0% | 4,4% | 2,3% | 3,4% | 3,6% |
| BPA - publié et non dilué | 0,8 | 0,7 | 1,0 | 0,4 | 0,7 | 0,7 |
| Dividende/action | 0,1 | 0,2 | 0,2 | 0,2 | 0,2 | 0,2 |
| Croissance (%) | 50,0% | 13,3% | 0,0% | 0,0% | 0,0% | |
| Dette nette/(trésorerie nette) | 0,2 | -2,5 | -1,4 | -6,5 | -7,2 | -8,2 |
| Gearing (%) | 1,8% | -17,4% | -8,7% | -37,8% | -38,5% | -40,2% |
| Dette nette/EBE (x) | 0,1 | -0,7 | -0,3 | -2,3 | -2,2 | -2,4 |
| FCF | -3,0 | 6,0 | -0,6 | 5,6 | 1,2 | 1,5 |
| ROCE (%) | 18,6% | 19,0% | 19,0% | 15,7% | 17,2% | 17,2% |
| VE/CA (x) | 0,5 | 0,4 | 0,2 | 0,1 | 0,1 | 0,1 |
| VE/EBE (x) | 8,8 | 6,8 | 3,4 | 2,7 | 2,1 | 1,7 |
| VE/ROC (x) | 9,4 | 7,8 | 3,5 | 3,2 | 2,5 | 2,0 |
| P/E (x) | 13,0 | 14,2 | 5,8 | 10,7 | 6,9 | 6,5 |
| FCF yield (%) | -9,6% | 24,6% | -4,1% | 65,5% | 13,9% | 19,3% |
| Dividend yield (%) | 1,0% | 1,7% | 3,4% | 3,7% | 3,7% | 3,7% |