Divertissement
France
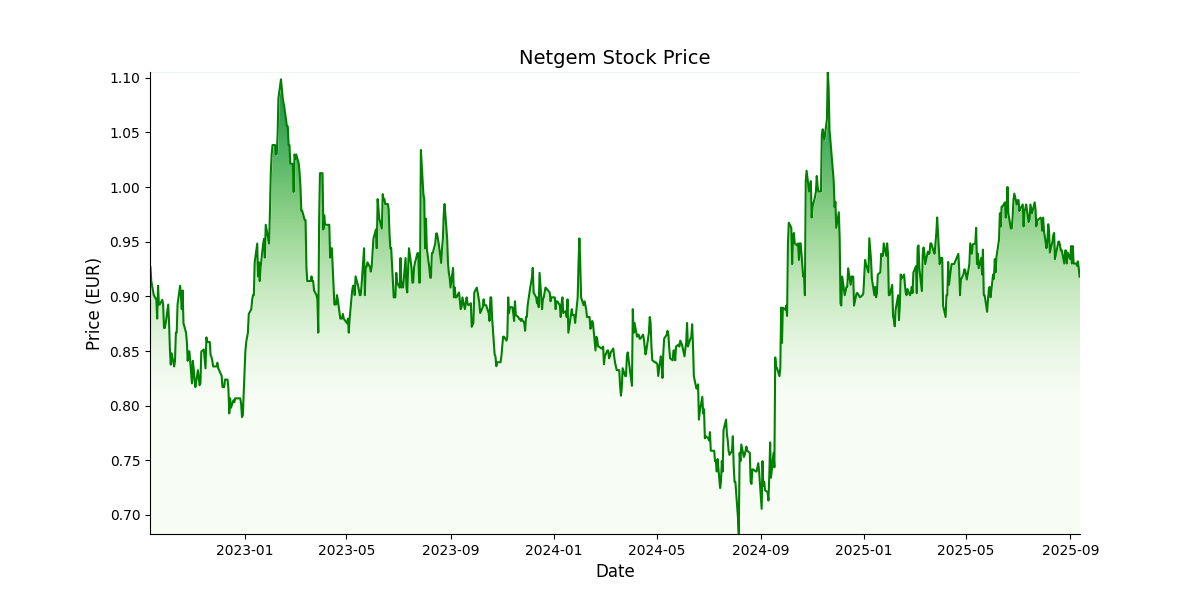
 Prix cible: EUR 1,6Prix actuel: EUR 0,8
Actionnariat:
Famille Haddad: 25.8%
Flottant: 42.3%
Autres: 27.9%
Autodétention: 4%
Apercu
Acteur historiquement positionné sur le hardware au travers des box internet, Netgem a initié un virage stratégique d’ampleur en 2020. Le groupe a recentré ses activités vers un modèle basé sur des revenus récurrents en commercialisant sa plateforme média en mode SaaS, Netgem.tv. Cette offre qui réunit plus de 677k abonnés en Europe permet à Netgem d’adresser un marché en expansion tout en jouant un rôle d’intermédiaire clé face aux enjeux et aux besoins des éditeurs de contenus et des opérateurs télécoms.
Management de
Netgem
- Mathias Hautefort (DG)
- Sandrine Alexandre (Directrice financière)
A la rencontre du dirigeant
| Données financières (M€) | 2022 | 2023 | 2024 | 2025e | 2026e |
|---|---|---|---|---|---|
| Chiffre d'affaires | 36 291,0 | 35 583,0 | 33 774,0 | 34 247,1 | 35 821,9 |
| Croissance (%) | 19,9% | -6,5% | 28,2% | -2,0% | -5,1% |
| EBE | 6 714,0 | 7 837,0 | 8 378,0 | 9 200,0 | 9 623,0 |
| Marge EBE (%) | 18,5% | 22,0% | 24,8% | 26,9% | 26,9% |
| ROC | -2 122,0 | 437,0 | 2 078,0 | 4 814,0 | 7 023,0 |
| Marge opérationnelle courante (%) | -5,8% | 1,2% | 6,2% | 14,1% | 19,6% |
| Résultat net part du groupe | 108,0 | 541,0 | 1 954,0 | 4 135,3 | 5 852,0 |
| Marge nette (%) | 0,3% | 1,5% | 5,8% | 12,1% | 16,3% |
| BPA - publié et non dilué | 0,0 | 0,0 | 0,1 | 0,1 | 0,2 |
| Dividende/action | 0,0 | 0,1 | 0,1 | 0,1 | 0,1 |
| Croissance (%) | 0,0% | 0,0% | 0,0% | ||
| Dette nette/(trésorerie nette) | -4 889,0 | -5 713,0 | -7 144,0 | -11 132,8 | -16 613,8 |
| Gearing (%) | -13,9% | -18,3% | -24,1% | -36,6% | -49,2% |
| Dette nette/EBE (x) | -0,5 | -0,6 | -0,7 | -1,1 | -1,6 |
| FCF | 786,0 | 4 083,0 | 3 465,0 | 5 733,1 | 7 225,4 |
| ROCE (%) | -21,0% | 3,6% | 20,9% | 61,7% | 117,5% |
| VE/CA (x) | 0,8 | 0,9 | 0,8 | 0,7 | 0,5 |
| VE/EBE (x) | 4,5 | 3,9 | 3,2 | 2,6 | 1,9 |
| VE/ROC (x) | -14,3 | 70,8 | 13,0 | 5,0 | 2,7 |
| P/E (x) | 322,5 | 67,7 | 17,5 | 8,5 | 6,0 |
| FCF yield (%) | 2,6% | 13,2% | 12,8% | 23,8% | 38,8% |
| Dividend yield (%) | 0,0% | 4,8% | 5,1% | 5,0% | 5,0% |