Santé
France
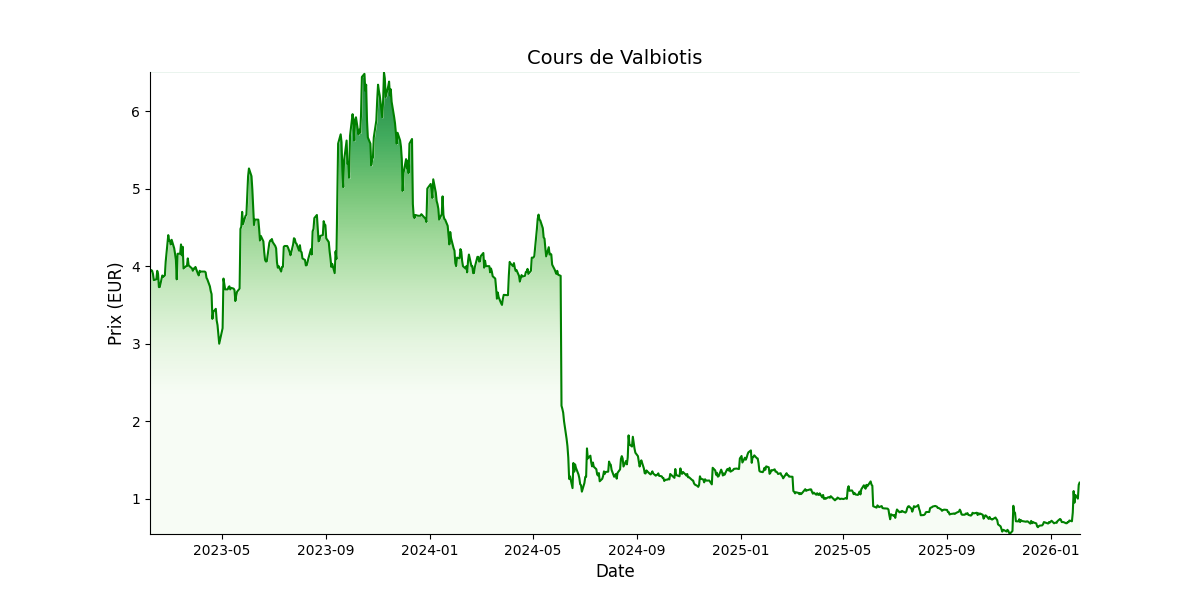
 Prix cible: EUR 1,7Prix actuel: EUR 0,6
 Hausse: 189.04%
 Capitalisation: (EURm) 21,4
 Ticker: ALVAL.PA
Actionnariat:
Sébastien Peltier (direct et indirect): 2%
Membres du directoire: 0.2%
Ximen RD PTE Ltd (Mr TAO): 6.5%
Apercu
Valbiotis est un laboratoire français, spécialisé dans la conception et la distribution de compléments alimentaires scientifiquement testés pour préserver la santé à chaque étape de la vie. A travers une approche innovante alliant excellence scientifique, expertise du végétal et richesse des ingrédients naturels, Valbiotis propose une nouvelle génération de compléments alimentaires pour soutenir l’équilibre et le bien-être cardio-métabolique et agir sur les problématiques santé du quotidien telles que le sommeil, la fatigue, la gestion de l’humeur, l’immunité ou encore la vitalité. Créée en 2014 à La Rochelle, l’Entreprise a noué de nombreux partenariats avec les meilleurs centres académiques
Management de
Valbiotis
- Sébastien Peltier (PDG & Co-fondateur)
- Stanislas Sordet (Directeur Administratif et Financier)
| Données financières (M€) | 2024 | 2025 | 2026 | 2027 | 2028 | 2029 |
|---|---|---|---|---|---|---|
| Chiffre d'affaires | 0,2 | 0,9 | 3,8 | 13,3 | 22,5 | 30,4 |
| Croissance (%) | 417,4% | 314,5% | 253,2% | 69,8% | 35,0% | |
| EBE | -9,9 | -9,2 | -8,1 | -4,9 | -0,2 | 3,5 |
| Marge EBE (%) | -5 651,4% | -1 010,7% | -215,8% | -37,3% | -0,8% | 11,4% |
| ROC | -10,4 | -9,5 | -8,3 | -5,2 | -0,4 | 3,2 |
| Marge opérationnelle courante (%) | -5 956,0% | -1 048,4% | -221,8% | -39,1% | -1,9% | 10,5% |
| Résultat net part du groupe | -10,0 | -9,4 | -8,3 | -5,4 | -0,6 | 2,9 |
| Marge nette (%) | -5 728,6% | -1 040,0% | -221,2% | -40,8% | -2,8% | 9,5% |
| BPA - publié et non dilué | -0,6 | -0,4 | -0,2 | -0,2 | 0,0 | 0,1 |
| Dividende/action | 0,0 | 0,0 | 0,0 | 0,0 | 0,0 | 0,0 |
| Croissance (%) | ||||||
| Dette nette/(trésorerie nette) | -5,9 | -3,6 | -4,4 | 3,7 | 5,3 | 3,7 |
| Gearing (%) | -56,5% | -51,5% | -57,9% | 172,7% | 350,6% | 84,9% |
| Dette nette/EBE (x) | 0,6 | 0,4 | 0,5 | -0,8 | -30,0 | 1,1 |
| FCF | -12,4 | -8,4 | -8,0 | -7,8 | -1,4 | 1,9 |
| ROCE (%) | -149,2% | -180,6% | -167,4% | -64,7% | -4,7% | 28,8% |
| VE/CA (x) | 192,1 | 19,8 | 5,6 | 2,2 | 1,4 | 1,0 |
| VE/EBE (x) | -3,4 | -2,0 | -2,6 | -6,0 | -176,7 | 8,7 |
| VE/ROC (x) | -3,2 | -1,9 | -2,5 | -5,7 | -71,7 | 9,4 |
| P/E (x) | -4,1 | -2,4 | -3,2 | -4,9 | -41,4 | 9,2 |
| FCF yield (%) | -36,9% | -46,7% | -37,9% | -26,5% | -4,4% | 6,4% |
| Dividend yield (%) | 0,0% | 0,0% | 0,0% | 0,0% | 0,0% | 0,0% |