Industriel
France
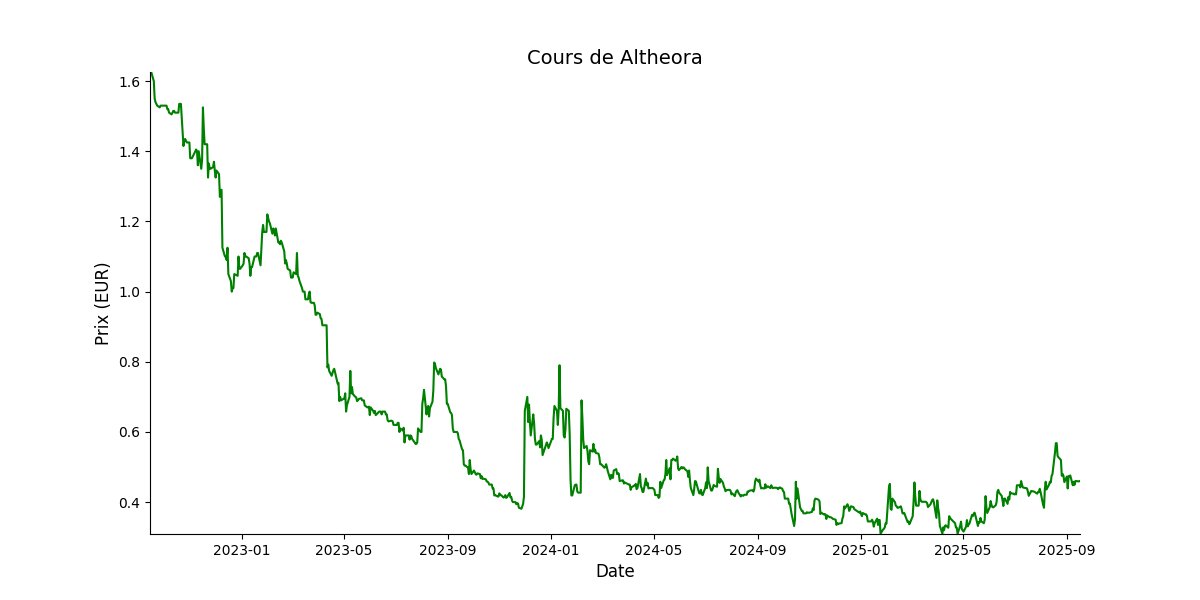
 Prix cible: EUR 0,8Prix actuel: EUR 0,5
Actionnariat:
Concert MC Partners & Associés : 45.4%
Flottant: 54.6%
Apercu
Historiquement spécialisée dans l’équipement de réseaux électriques, Altheora est aujourd’hui un leader de la conception et la transformation de matériaux composites. La société est organisée autour de trois pôles de compétences : 1/ la transformation de matériaux composites, 2/ le parachèvement de pièces industrielles et 3/ l’accélération de projets industriels par l’innovation (depuis 2020).
Introduite depuis 1988 et cotée depuis 2016 sur Euronext Growth, Altheora s’est développée de manière organique et externe (2 acquisitions depuis 2020). Cette croissance est le fruit d’une stratégie basée sur un savoir-faire industriel solide, un repositionnement sur des secteurs porteurs et des efforts soutenus sur l’innovation.
Management de
Altheora
- Bénédicte Durand (DG)
A la rencontre du dirigeant
| Données financières (M€) | 2021 | 2022 | 2023 | 2024 | 2025 | 2026 |
|---|---|---|---|---|---|---|
| Chiffre d'affaires | 32,0 | 35,0 | 41,3 | 37,0 | 41,0 | 43,0 |
| Croissance (%) | 25,2% | 9,6% | 18,0% | -10,5% | 10,8% | 5,0% |
| EBE | 1,4 | 0,9 | 1,9 | 2,0 | 3,2 | 3,9 |
| Marge EBE (%) | 4,4% | 2,5% | 4,6% | 5,3% | 7,9% | 9,0% |
| ROC | -0,3 | -1,3 | -0,9 | -0,9 | 0,4 | 1,0 |
| Marge opérationnelle courante (%) | -0,9% | -3,6% | -2,2% | -2,4% | 1,0% | 2,4% |
| Résultat net part du groupe | -0,2 | -1,7 | -2,0 | -1,7 | 1,2 | 1,9 |
| Marge nette (%) | -0,7% | -4,8% | -4,9% | -4,7% | 3,0% | 4,4% |
| BPA - publié et non dilué | 0,0 | -0,1 | -0,1 | -0,1 | 0,1 | 0,1 |
| Dividende/action | 0,0 | 0,0 | 0,0 | 0,0 | 0,0 | 0,0 |
| Croissance (%) | ||||||
| Dette nette/(trésorerie nette) | 6,1 | 12,7 | 11,6 | 11,7 | 10,2 | 7,9 |
| Gearing (%) | 68,6% | 90,2% | 95,3% | 114,3% | 89,0% | 59,1% |
| Dette nette/EBE (x) | 4,3 | 14,8 | 6,1 | 5,9 | 3,2 | 2,0 |
| FCF | -4,9 | 2,1 | -2,0 | -2,1 | 1,5 | 2,3 |
| ROCE (%) | -1,4% | -3,4% | -2,8% | -2,9% | 1,4% | 3,6% |
| VE/CA (x) | 0,6 | 1,0 | 0,5 | 0,4 | 0,3 | 0,3 |
| VE/EBE (x) | 14,3 | 39,8 | 11,2 | 8,3 | 4,4 | 3,1 |
| VE/ROC (x) | 33,1 | 11,3 | ||||
| P/E (x) | 3,4 | 2,2 | ||||
| FCF yield (%) | -26,1% | -23,8% | 0,8% | -13,5% | 35,6% | 55,3% |
| Dividend yield (%) | 0,0% | 0,0% | 0,0% | 0,0% | 0,0% | 0,0% |