Medtech
France
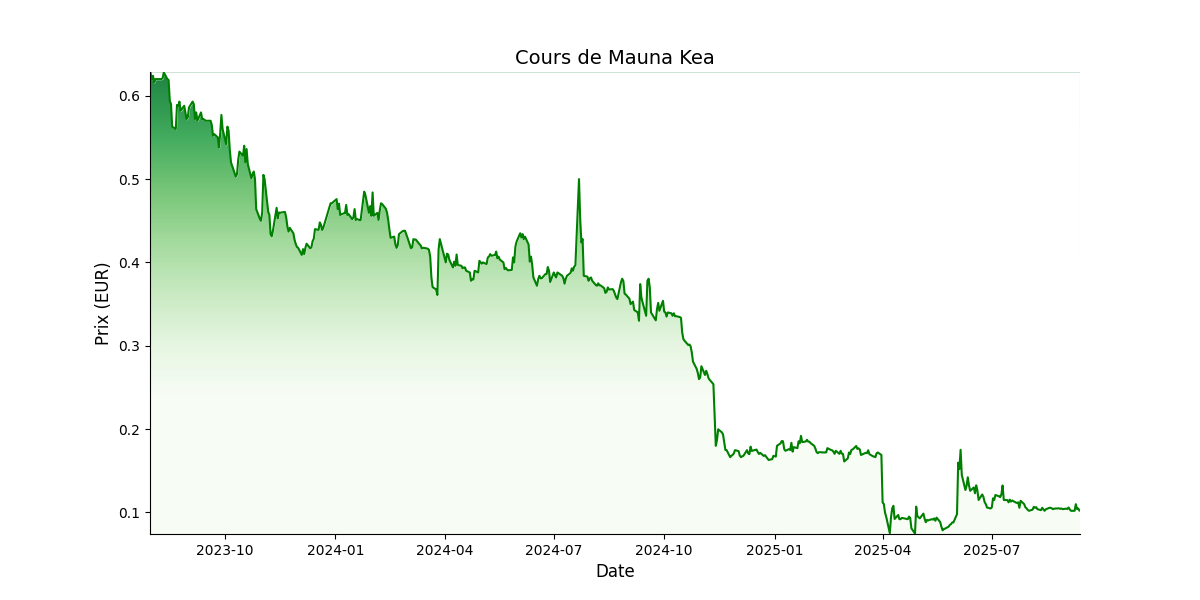
 Prix cible: EUR 0,5Prix actuel: EUR 0,2
Actionnariat:
Telix: 19.2%
Johnson & Johnson: 17.4%
Float: 61.2%
Fondateurs/ Mgmt: 2.2%
Apercu
Fondée en 2000, Mauna Kea Technologies se positionne en tant qu’acteur mondial dans le domaine des dispositifs médicaux. La société se spécialise dans le développement, la production et la commercialisation d'une plateforme d'imagerie médicale. Cette technologie novatrice permet d'observer les tissus à l'échelle cellulaire en temps réel, intégrant cette capacité au cours de procédures médicales standards. La mission de l'entreprise consiste à réduire les incertitudes associées aux diagnostics et aux traitements en offrant une visualisation directe des tissus in vivo à un niveau microscopique. Le produit phare du groupe, le Cellvizio, est un microscope miniature intégré à une unité centrale. Grâce à sa mini sonde spécifique à chaque indication médicale et sa miniaturisation extrême, il peut être positionné directement dans le corps du patient. Cette visualisation in vivo améliore les prélèvements de tissus, permet des diagnostics plus précis, surveille l'évolution des maladies, évalue les réactions en temps réel, identifie les zones d'incertitude, et guide les interventions chirurgicales.
Management de
Mauna Kea
- Sacha Loiseau (PDG)
- Côme La Tour du Pin (DAF)
A la rencontre du dirigeant
| Données financières (M€) | 2022 | 2023 | 2024 | 2025 | 2026 | 2027 |
|---|---|---|---|---|---|---|
| Chiffre d'affaires | 7,5 | 10,5 | 7,7 | 6,6 | 14,0 | 15,5 |
| Croissance (%) | -2,9% | 40,1% | -27,0% | -13,6% | 110,9% | 11,1% |
| EBE | -7,0 | -4,0 | -4,3 | -5,2 | -3,1 | 0,3 |
| Marge EBE (%) | -93,4% | -37,9% | -55,8% | -78,8% | -22,3% | 1,8% |
| ROC | -9,0 | -5,7 | -6,0 | -5,9 | -4,2 | -1,0 |
| Marge opérationnelle courante (%) | -120,1% | -54,3% | -79,0% | -88,8% | -30,3% | -6,2% |
| Résultat net part du groupe | -11,2 | -3,7 | -10,4 | -8,3 | -5,2 | -1,0 |
| Marge nette (%) | -149,5% | -35,6% | -135,9% | -125,9% | -37,5% | -6,5% |
| BPA - publié et non dilué | -0,3 | -0,1 | -0,2 | -0,1 | -0,1 | 0,0 |
| Dividende/action | 0,0 | 0,0 | 0,0 | 0,0 | 0,0 | 0,0 |
| Croissance (%) | ||||||
| Dette nette/(trésorerie nette) | 26,1 | 21,8 | 29,9 | 30,8 | 32,3 | 32,2 |
| Gearing (%) | -130,8% | -126,2% | -122,7% | -122,2% | -157,7% | -164,7% |
| Dette nette/EBE (x) | -3,7 | -5,5 | -7,0 | -5,9 | -10,3 | 114,3 |
| FCF | -9,0 | -1,1 | -6,5 | -9,9 | -11,4 | -1,0 |
| ROCE (%) | -107,6% | -92,0% | -80,0% | -76,6% | -26,6% | -5,6% |
| VE/CA (x) | 7,0 | 4,9 | 6,6 | 5,0 | 2,5 | 2,2 |
| VE/EBE (x) | 7,9 | |||||
| VE/ROC (x) | ||||||
| P/E (x) | ||||||
| FCF yield (%) | ||||||
| Dividend yield (%) | 0,0% | 0,0% | 0,0% | 0,0% | 0,0% | 0,0% |