Marketing Digital
France
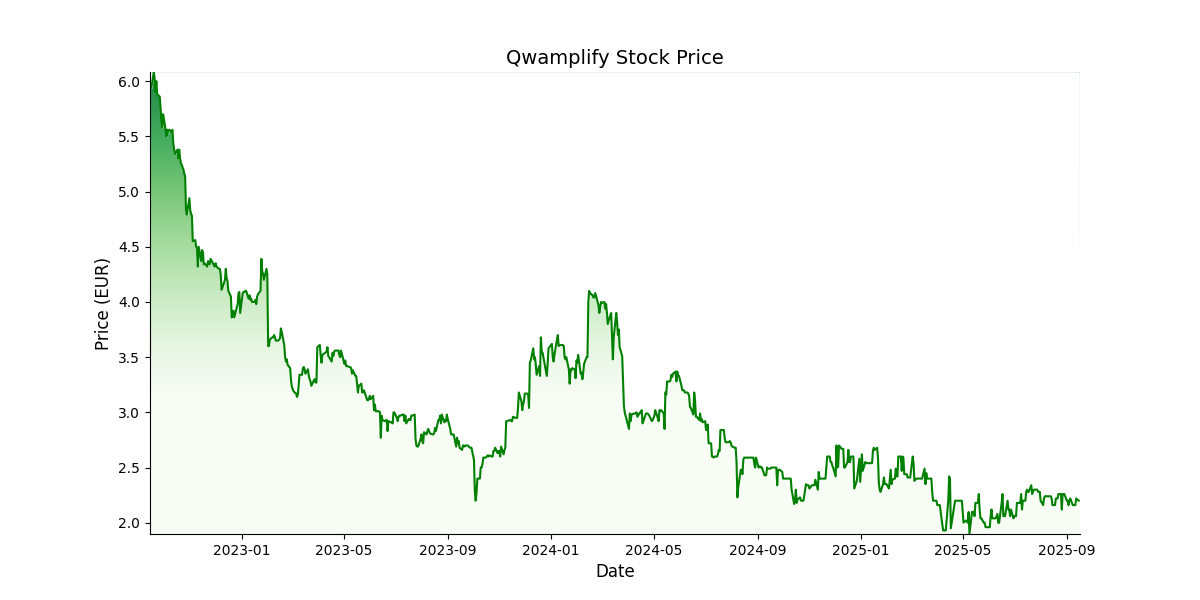
 Prix cible: EUR 3,5Prix actuel: EUR 1,8
Actionnariat:
Flottant: 55%
Cédric Reny: 31%
Autres: 14%
Apercu
Créé en 1997, Qwamplify est un groupe de marketing européen de services digital & data auprès des marques, distributeurs et ecommerçants disposant d'une solide notoriété acquise auprès de plus de 800 annonceurs. A travers une politique très active de croissance externe, la groupe a su élargir son offre pour proposer aujourd’hui une suite complète de solutions B2B et B2C, à la fois digitales avec Media (SEO, SEA, emailing, display, branding, social, analytics) et promotionnelles avec Shopper (ODR, CRM, etc.).
Management de
Qwamplify
- Cédric Reny (Président)
- Jérémy Bréot (DG)
- Wilfrid Hotome (DAF)
A la rencontre du dirigeant
| Données financières (M€) | 2022 | 2023 | 2024 (5T) | 2025e | 2026 | 2027 |
|---|---|---|---|---|---|---|
| Chiffre d'affaires | 31,1 | 31,5 | 41,9 | 26,4 | 27,7 | 28,6 |
| Croissance (%) | 0,4% | 1,3% | 26,6% | -20,2% | -33,9% | -13,5% |
| EBE | 3,7 | 2,9 | 3,7 | 1,6 | 2,3 | 2,4 |
| Marge EBE (%) | 11,9% | 9,2% | 8,8% | 5,9% | 8,3% | 8,2% |
| ROC | 3,7 | 2,4 | 3,2 | 1,2 | 1,9 | 1,9 |
| Marge opérationnelle courante (%) | 12,0% | 7,5% | 7,6% | 4,4% | 6,8% | 6,7% |
| Résultat net part du groupe | 1,3 | -9,2 | 1,2 | 0,9 | 1,4 | 1,4 |
| Marge nette (%) | 4,1% | -29,0% | 2,9% | 3,4% | 5,0% | 5,0% |
| BPA - publié et non dilué | 0,2 | -1,6 | 0,2 | 0,2 | 0,2 | 0,3 |
| Dividende/action | 0,0 | 0,0 | 0,0 | 0,0 | 0,0 | 0,0 |
| Croissance (%) | ||||||
| Dette nette/(trésorerie nette) | -2,6 | -4,3 | -5,6 | -5,6 | -7,4 | -9,1 |
| Gearing (%) | -7,6% | -17,5% | -20,8% | -20,8% | -25,9% | -30,6% |
| Dette nette/EBE (x) | -0,7 | -1,5 | -1,5 | -3,6 | -3,2 | -3,9 |
| FCF | 1,6 | 3,1 | 3,1 | 1,0 | 1,7 | 1,8 |
| ROCE (%) | 10,2% | 11,2% | 16,5% | 4,5% | 7,4% | 7,7% |
| VE/CA (x) | 1,2 | 0,5 | 0,2 | 0,2 | 0,1 | 0,1 |
| VE/EBE (x) | 10,3 | 5,2 | 2,5 | 3,2 | 1,4 | 0,6 |
| VE/ROC (x) | 10,3 | 6,3 | 2,9 | 4,3 | 1,7 | 0,8 |
| P/E (x) | 33,6 | -2,2 | 13,6 | 14,0 | 9,0 | 8,7 |
| FCF yield (%) | 3,7% | 15,4% | 18,7% | 8,3% | 13,9% | 14,3% |
| Dividend yield (%) | 0,0% | 0,0% | 0,0% | 0,0% | 0,0% | 0,0% |