Electronique
France
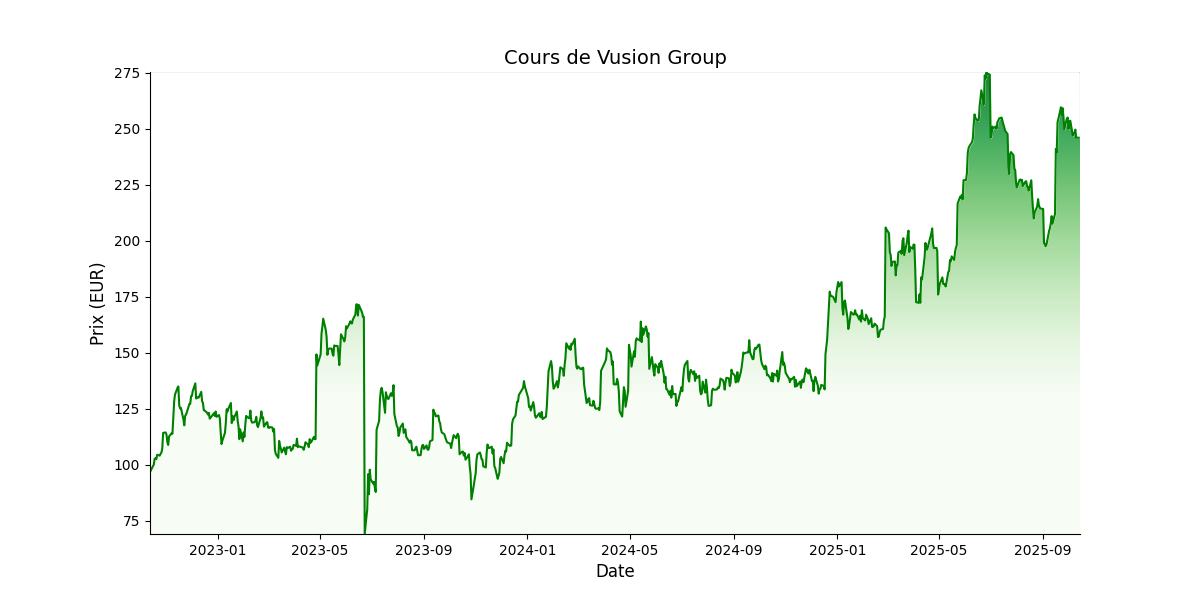
 Prix cible: EUR 285,0Prix actuel: EUR 130,3
Actionnariat:
BOE : 23.9%
SESIM: 10.5%
BPI: 7.8%
E-Ink: 5.8%
Flottant: 52%
Apercu
VusionGroup (ex SES-Imagotag) est le leader mondial des solutions digitales pour le commerce physique. La société, qui compte plus de 350 clients grands comptes, conçoit et déploie pour les acteurs du retail des étiquettes électroniques et des solutions IoT (via sa plateforme VUSION) destinées à les aider dans leur transformation digitale. Avec son plan stratégique qui vise à horizon 2027, le groupe semble armé pour poursuivre sa conquête du marché mondial, fort d’un management hors du commun et d’une qualité d’exécution sans commune mesure. Le récent contrat signé avec Walmart sécurise par ailleurs grandement le développement à moyen et long terme de la société.
Management de
Vusion Group
- Thierry Gadou (PDG)
- Thierry Lemaitre (DAF)
| Données financières (M€) | 2022 | 2023 | 2024 | 2025 | 2026 | 2027 |
|---|---|---|---|---|---|---|
| Chiffre d'affaires | 620,9 | 802,0 | 954,7 | 1 440,0 | 1 755,4 | 2 110,0 |
| Croissance (%) | 46,8% | 29,2% | 19,0% | 50,8% | 21,9% | 20,2% |
| EBE | 58,6 | 106,0 | 160,4 | 275,7 | 393,2 | 501,0 |
| Marge EBE (%) | 9,4% | 13,2% | 16,8% | 19,1% | 22,4% | 23,7% |
| ROC | 31,7 | 51,5 | 23,3 | 58,1 | 102,9 | 181,9 |
| Marge opérationnelle courante (%) | 5,1% | 6,4% | 2,4% | 4,0% | 5,9% | 8,6% |
| Résultat net part du groupe | 18,6 | 79,6 | -28,9 | 35,0 | 68,6 | 127,8 |
| Marge nette (%) | 3,0% | 9,9% | -3,0% | 2,4% | 3,9% | 6,1% |
| BPA - publié et non dilué | 1,1 | 1,8 | 2,9 | 6,1 | 10,9 | 13,9 |
| Dividende/action | 0,0 | 0,3 | 0,6 | 0,7 | 1,3 | 2,4 |
| Croissance (%) | 100,0% | 8,6% | 96,1% | 86,4% | ||
| Dette nette/(trésorerie nette) | 40,5 | -27,3 | -392,8 | -474,0 | -330,8 | -313,3 |
| Gearing (%) | 20,9% | -9,8% | -161,0% | -113,0% | -69,3% | -53,7% |
| Dette nette/EBE (x) | 0,7 | -0,3 | -2,4 | -1,7 | -0,8 | -0,6 |
| FCF | -31,0 | 160,8 | 386,6 | 19,3 | -132,3 | 3,9 |
| ROCE (%) | 9,3% | 12,8% | -18,8% | 3 180,7% | 38,2% | 41,8% |
| VE/CA (x) | 2,5 | 2,5 | 2,0 | 2,1 | 1,8 | 1,5 |
| VE/EBE (x) | 26,8 | 18,6 | 12,2 | 11,1 | 8,1 | 6,4 |
| VE/ROC (x) | 50,0 | 29,9 | 41,4 | 27,7 | 20,6 | 13,0 |
| P/E (x) | 81,7 | 25,2 | 97,6 | 49,8 | 26,7 | |
| FCF yield (%) | 8,2% | 19,9% | 0,6% | 0,1% | ||
| Dividend yield (%) | 0,0% | 0,3% | 0,4% | 0,3% | 0,6% | 1,1% |