Services financiers
France
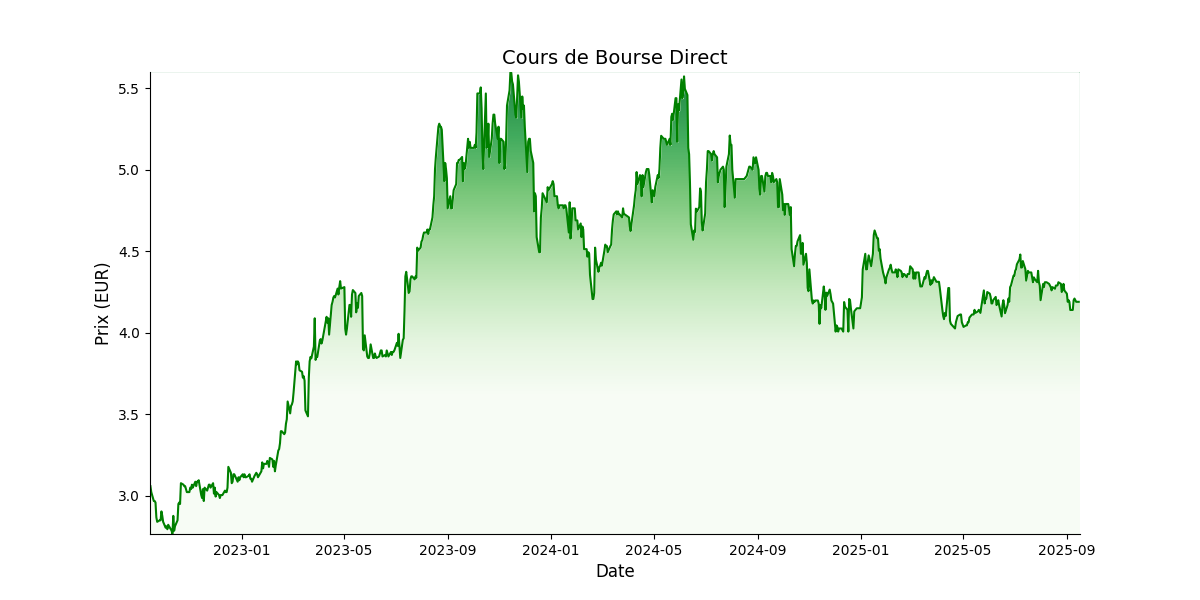
 Prix cible: EUR 7,0Prix actuel: EUR 5,4
Actionnariat:
E-Viel: 83.2%
Institutionnels: 10.6%
Public: 6.2%
Auto-contrôle: 0.2%
Apercu
Avec plus de 4,5 millions d’ordre exécutés en 2023, Bourse Direct est un acteur majeur du courtage en ligne en France. Dotée d’une offre particulièrement attractive (commissions de courtage parmi les plus basses du marché, service clients maintes fois plébiscité), la société parvient à se démarquer au sein d’un marché relativement concurrentiel. Le groupe exploite aujourd’hui trois segments d’activité complémentaires et diversifiés : le pôle bourse (courtage et tenue de compte/conservation), le pôle placement (trésorerie et épargne) et le pôle portail, à travers lequel il monétise son site internet. La récente remontée des taux est une opportunité exceptionnelle pour le groupe, qui peut placer d’importants montants sur des dépôts à terme bien rémunérés et avec une maturité plutôt longue.
Management de
Bourse Direct
- Catherine Nini (PDG)
- Virginie de Vichet (DGD)
A la rencontre du dirigeant
| Données financières (M€) | 2021 | 2022 | 2023 | 2024 | 2025e | 2026e |
|---|---|---|---|---|---|---|
| Chiffre d'affaires | 39,8 | 42,3 | 62,3 | 70,4 | 70,3 | 74,1 |
| Croissance (%) | 2,8% | 6,2% | 47,3% | 13,0% | -0,1% | 5,3% |
| EBE | 11,7 | 9,6 | 25,2 | 29,7 | 29,7 | 31,5 |
| Marge EBE (%) | 29,4% | 22,7% | 40,5% | 42,2% | 42,2% | 42,5% |
| ROC | 10,0 | 7,8 | 22,0 | 26,2 | 26,7 | 28,3 |
| Marge opérationnelle courante (%) | 25,1% | 18,5% | 35,3% | 37,3% | 38,0% | 38,2% |
| Résultat net part du groupe | 7,3 | 5,7 | 15,9 | 19,1 | 19,7 | 21,0 |
| Marge nette (%) | 18,3% | 13,5% | 25,5% | 27,1% | 28,1% | 28,4% |
| BPA - publié et non dilué | 0,1 | 0,1 | 0,3 | 0,4 | 0,4 | 0,4 |
| Dividende/action | 0,1 | 0,1 | 0,2 | 0,2 | 0,2 | 0,3 |
| Croissance (%) | 40,0% | 14,3% | 100,0% | 25,0% | 20,0% | 6,5% |
| Dette nette/(trésorerie nette) | -35,3 | -43,3 | -56,0 | -56,3 | -59,7 | -65,1 |
| Gearing (%) | -52,7% | -63,3% | -73,5% | -70,0% | -67,3% | -62,4% |
| Dette nette/EBE (x) | -3,0 | -4,5 | -2,2 | -1,9 | -2,0 | -2,1 |
| FCF | -3,6 | 12,1 | 22,5 | 16,3 | 16,2 | 17,7 |
| ROCE (%) | 10,9% | 8,4% | 20,9% | 23,7% | 22,2% | 20,1% |
| VE/CA (x) | 3,5 | 3,1 | 3,2 | 3,1 | 3,0 | 2,7 |
| VE/EBE (x) | 11,9 | 13,6 | 7,9 | 7,3 | 7,1 | 6,4 |
| VE/ROC (x) | 13,9 | 16,7 | 9,0 | 8,2 | 7,8 | 7,1 |
| P/E (x) | 23,8 | 30,3 | 16,0 | 14,3 | 13,6 | 12,6 |
| FCF yield (%) | -2,1% | 7,0% | 8,8% | 6,0% | 6,0% | 6,7% |
| Dividend yield (%) | 2,3% | 2,5% | 3,4% | 3,9% | 4,7% | 5,0% |