Industrie
France
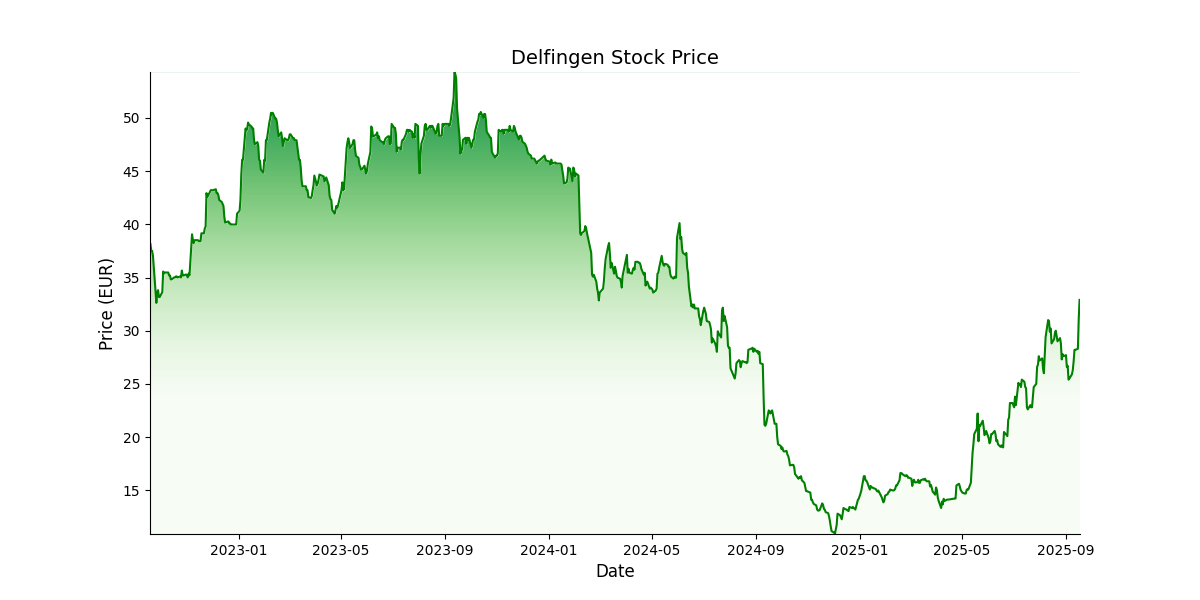
 Prix cible: EUR 40,0Prix actuel: EUR 28,6
Actionnariat:
Famille Streit: 56.7%
Weinberg Capital: 9.3%
Flottant: 24.5%
ASCOM: 9.5%
Apercu
Créé en 1954, Delfingen est un équipementier automobile mondial, devenu leader dans les solutions de protection des réseaux électriques et fluides embarqués. Le groupe s’adresse à deux principaux marchés : le marché automobile et au marché industriel. Sur le marché automobile, Delfingen propose des systèmes de protection des faisceaux électriques, des tubes et durites. Sur le marché industriel, Delfingen propose aussi des systèmes de protection. En 2020, Delfingen a acquis les activités de Schlemmer, un de ses principaux concurrents, sur le territoire Europe/Afrique afin de renforcer ses parts de marché en Europe et sa proximité avec les constructeurs allemands (notamment pour véhicules lourds), mais aussi de mutualiser les efforts de R&D dans les motorisations hybrides/électriques. .
Management de
Delfingen
- Gérald Streit (PDG)
- Christophe Clerc (CFO)
A la rencontre du dirigeant
| Données financières (M€) | 2022 | 2023 | 2024 | 2025e | 2026e | 2027e |
|---|---|---|---|---|---|---|
| Chiffre d'affaires | 417,1 | 456,7 | 423,7 | 400,3 | 395,2 | 437,5 |
| Croissance (%) | 14,9% | 9,5% | -7,2% | -5,5% | -1,3% | 10,7% |
| EBE | 40,0 | 49,0 | 46,2 | 49,8 | 49,9 | 57,5 |
| Marge EBE (%) | 9,6% | 10,7% | 10,9% | 12,4% | 12,6% | 13,1% |
| ROC | 21,0 | 28,1 | 23,8 | 28,3 | 28,7 | 33,9 |
| Marge opérationnelle courante (%) | 5,0% | 6,2% | 5,6% | 7,1% | 7,3% | 7,8% |
| Résultat net part du groupe | 8,1 | 7,0 | -0,2 | 13,2 | 14,6 | 18,0 |
| Marge nette (%) | 1,9% | 1,5% | 0,0% | 3,3% | 3,7% | 4,1% |
| BPA - publié et non dilué | 3,0 | 2,7 | -0,1 | 5,1 | 5,6 | 6,9 |
| Dividende/action | 0,6 | 1,2 | 0,8 | 1,0 | 0,8 | 1,0 |
| Croissance (%) | 82,8% | -34,2% | 32,1% | -17,4% | 23,0% | |
| Dette nette/(trésorerie nette) | 128,2 | 147,2 | 145,9 | 128,4 | 110,4 | 96,1 |
| Gearing (%) | 87,9% | 99,8% | 98,1% | 80,1% | 64,0% | 51,0% |
| Dette nette/EBE (x) | 3,2 | 3,0 | 3,2 | 2,6 | 2,2 | 1,7 |
| FCF | -12,2 | 31,5 | 23,1 | 19,5 | 20,7 | 16,4 |
| ROCE (%) | 5,6% | 7,0% | 5,8% | 7,1% | 7,3% | 8,6% |
| VE/CA (x) | 0,6 | 0,6 | 0,5 | 0,5 | 0,5 | 0,4 |
| VE/EBE (x) | 6,3 | 5,7 | 4,8 | 4,4 | 4,0 | 3,2 |
| VE/ROC (x) | 12,1 | 9,9 | 9,4 | 7,7 | 7,0 | 5,5 |
| P/E (x) | 15,7 | 19,1 | 6,9 | 6,3 | 5,1 | |
| FCF yield (%) | -4,8% | 11,3% | 10,3% | 9,0% | 10,3% | 8,8% |
| Dividend yield (%) | 1,3% | 2,3% | 2,5% | 2,9% | 2,4% | 2,9% |